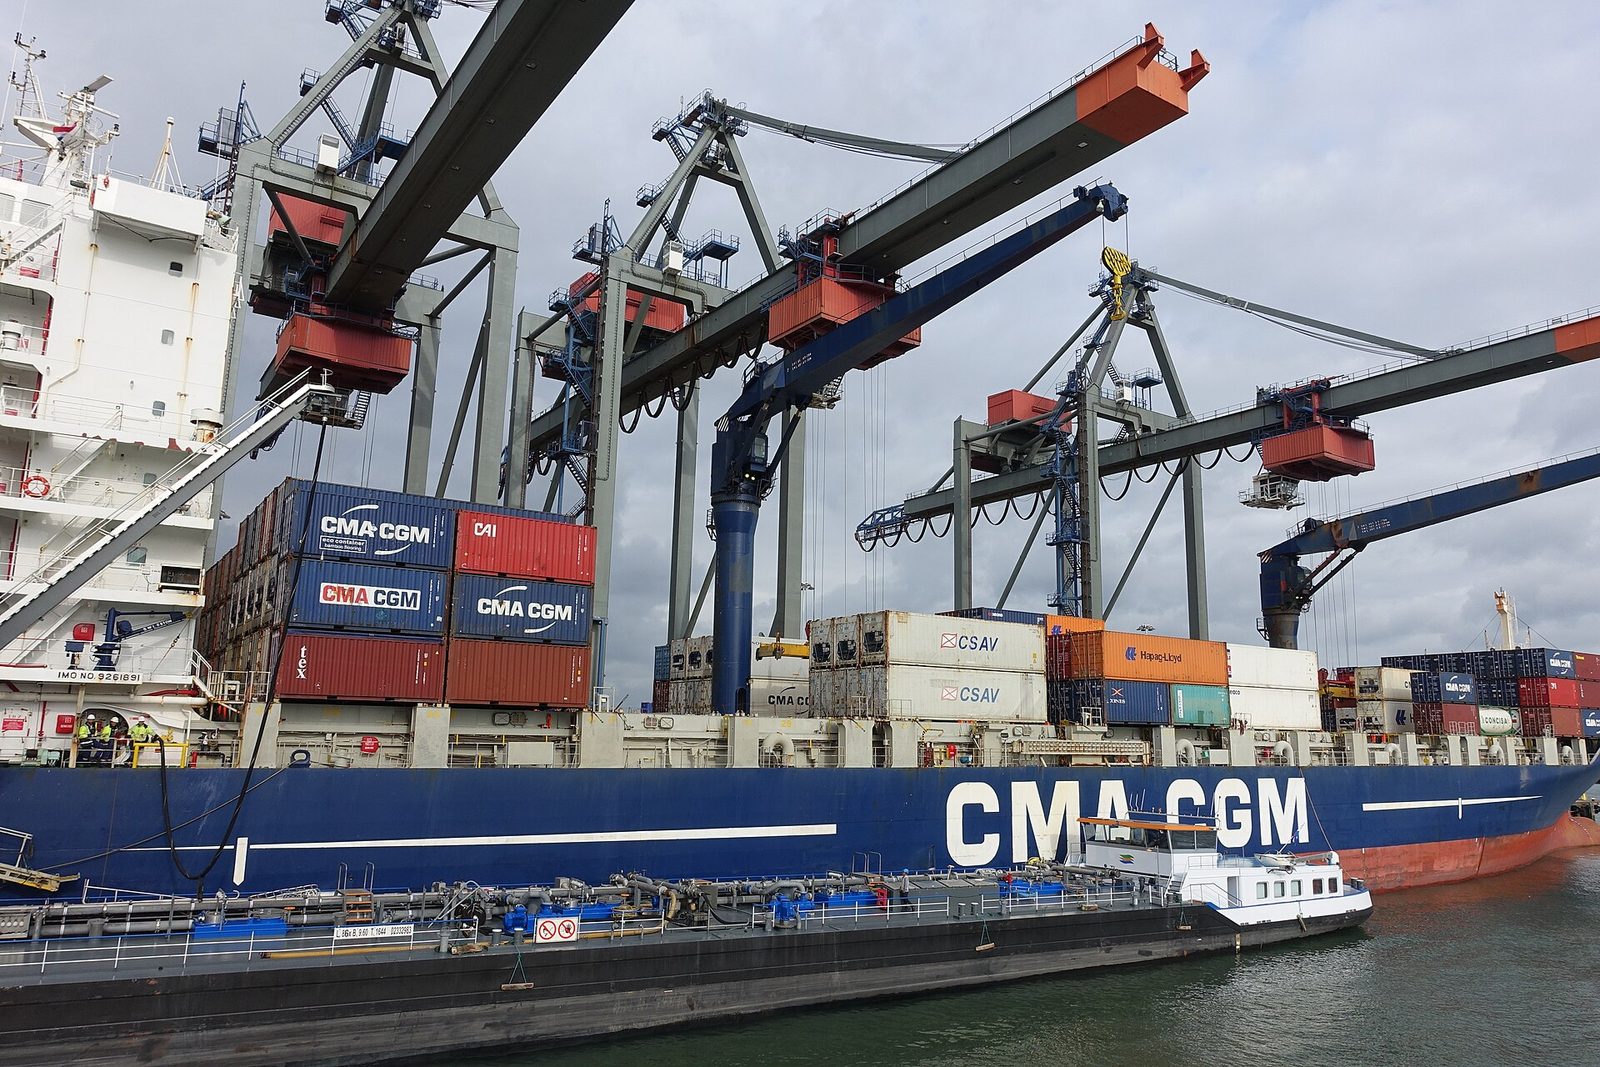
Anyone searching for EU import data runs into the same wall within an hour. The statistics are excellent, free and go back decades. The company names are not there. Eurostat will tell you that the EU imported €560.5 billion of goods from China in 2025, 22.3% of all imports, and it will slice that to eight digits by month and member state. What it will never tell you is which company in Antwerp took delivery. That gap is the single most important thing to understand about EU import data, and this guide explains where the official numbers live, how to read them by HS code, why consignee names are missing, and what practitioners actually do to find named EU importers.
The 30-second version
- Comext is Eurostat's reference database for EU external trade, free, and coded to CN8, an eight-digit extension of the six-digit HS.
- EU import data is aggregate only. No member state publishes bill-of-lading manifests or consignee names the way the US does.
- Top 2025 sources: China €560.5B (22.3%), United States €355.5B (14.1%), United Kingdom €158.6B (6.3%).
- Data lands roughly 2 to 3 months after the reference period.
- Watch the Rotterdam effect: goods clearing in the Netherlands or Belgium and moving on inflate those countries in the statistics.
Where does official EU import data come from?
One database, several front doors. Eurostat collects trade statistics from all 27 member states and publishes them through Comext, the reference database for external trade. It holds current and historical values and quantities for imports and exports, by product and partner country, per the EUI library's Comext guide.
Three access routes are worth knowing:
- Easy Comext for interactive queries, filtered by product, partner, flow and period.
- Bulk download for full CSV extracts when you want to work in your own tools.
- National statistical offices for faster or more detailed national cuts, such as Destatis for Germany or CBS for the Netherlands.
Above that sits TARIC, which is not statistics but tariff: duty rates, quotas, anti-dumping measures and restrictions by code. Statistics tell you what moved. TARIC tells you what it costs to move it.
How do you read EU import data by HS code?
EU trade data is classified under the Combined Nomenclature, an eight-digit system built on top of the international HS. The first six digits are the HS code every country shares. Digits seven and eight are EU-specific. Comext lets you query at HS2, HS4, HS6 or CN8, so pick your level deliberately: HS6 to compare across countries, CN8 when you need the exact EU product line.
A worked example. Searching CN8 for your product with extra-EU as the flow gives imports from outside the bloc. Switching to intra-EU gives movements between member states, which for many categories is the larger number and a completely different commercial story. New to codes? Start here on HS codes.
Why can't you get EU importer names?
Because no EU member state publishes them. The United States releases vessel manifest data, which is why US import records carry named consignees. The EU treats the equivalent data as confidential commercial information, and Eurostat's remit is statistics rather than transaction disclosure. On top of that, individual flows can be suppressed entirely where publishing them would reveal a single trader's business.
So the honest answer to "where can I download a list of EU importers" is that no official source provides one. What exists instead is mirror data: the export records of partner countries showing shipments into the EU, joined with licensed shipment databases that carry consignee detail where disclosure rules allow. It is the same method used for Turkey and most of Asia, and the underlying logic is covered in how to use customs data to find buyers.
Eurostat answers "how much". It never answers "who". Every serious EU buyer list is built by joining partner-country export records to the aggregate picture.
The Rotterdam effect, and other traps
Four things distort EU import data if you read it literally.
- Quasi-transit. Goods clearing customs in Rotterdam or Antwerp then moving to Germany or Poland are recorded as Dutch or Belgian imports. The Netherlands looks like a far bigger consumer than it is. Read the Netherlands gateway picture with that in mind.
- Country of consignment versus country of origin. These are different fields and they routinely disagree. A Chinese-made part shipped from a German warehouse is Chinese by origin and German by consignment.
- Confidentiality suppression. Small or concentrated flows get masked, so a zero is sometimes a redaction rather than an absence.
- The lag. Figures publish about two to three months after the period, so "latest" is rarely last month.
A chemicals exporter once spent a quarter targeting Dutch buyers because Comext showed the Netherlands as the leading destination for their CN8 line. The actual consumption was in North Rhine-Westphalia. The port did the importing; the factories did the buying.
How do you find named EU importers?
Work backwards from the flow, then verify.
- Fix the code. HS6 for cross-country comparison, CN8 for EU precision.
- Size the market in Comext. Which member states import your line, in what volume, from which origins, and is the trend up or down.
- Switch to mirror records to see individual shipments into those member states, with consignee names where disclosure allows.
- Rank by consistency. A buyer with twelve shipments a year is a working distributor. One large arrival is often a project purchase that never repeats.
- Check compliance exposure before pitching. If your product touches CBAM or EUDR, the buyer will ask, and having the answer ready wins the meeting.
- Verify the company against registry records before quoting. Here is how to check a counterparty properly.
How ShipScout helps
ShipScout sits on the second half of that workflow, where Eurostat stops. 11B+ shipment records across 240+ countries, searchable by product or HS code:
- Search your code with EU destinations and see actual shipments: origin, volume, value, date.
- Rank importers by shipment count rather than by whoever bought the top ad slot in a directory.
- Compare member states side by side to separate the gateway from the end market, across Germany, France, Italy and Poland.
- Pull contact details where available and open with the buyer's own import history.
Free statistics tell you where the market is. Shipment data tells you who to call. Start a free trial and run your HS code against EU destinations.
See who’s importing goods into the EU right now.
ShipScout turns 11B+ shipment records across 240+ countries into a live list of verified buyers and suppliers, ranked by volume, with the contacts to reach them. Create a free account and run your first search in minutes.
Start your free trial →