Australia bought A$629.9 billion of goods and services from the rest of the world in 2024-25, up A$26.2 billion (4.4%) on the year, per the Australian Bureau of Statistics. Strip out services and the goods bill alone ran to roughly US$297.5 billion in 2025, a 4.6% rise, per figures compiled from ABS and UN Comtrade. Behind the totals sits one fact every exporter can use: a wealthy market of 27 million people that mines and farms brilliantly but makes very little of what it actually consumes. That gap is what Australia import data closes — it names the products flowing in, the countries shipping them, and, worked the right way, the Australian importers signing the cheques. This guide covers what Australia buys, who supplies it, how the India-Australia ECTA rewired the tariff maths, and how to turn shipment records into a ranked buyer list.
The 30-second version
- Australia imported A$629.9 billion of goods and services in 2024-25 (+4.4%); goods alone were about US$297.5 billion in 2025.
- Machinery and computers (US$43B), vehicles ($39.6B) and mineral fuels ($34.5B) top the shopping list — a textbook import-dependent economy.
- China supplied 35.6% of goods imports, more than the next four sources combined; the US, Japan, South Korea and Thailand fill out the top five.
- Under the India-Australia ECTA (in force since December 2022), India's exports to Australia more than doubled to US$8.5 billion in FY2024-25.
- Australia publishes aggregate statistics only — Australian importer names come from mirrored partner-country shipment records, not a public manifest.
What does Australia import the most?
Machinery and computers lead at US$43 billion, 14.5% of Australia's US$297.5 billion goods-import bill in 2025, followed by vehicles at $39.6 billion and mineral fuels and electrical machinery at $34.5 billion each, per World's Top Exports. Read the list and the pattern jumps out: Australia imports the finished and refined things it chooses not to build at home.
The full top ten by HS chapter — the view you get reading Australia import data by HS code:
| HS chapter | Category | 2025 imports |
|---|---|---|
| 84 | Machinery including computers | $43.0B |
| 87 | Vehicles | $39.6B |
| 27 | Mineral fuels including oil | $34.5B |
| 85 | Electrical machinery and equipment | $34.5B |
| 71 | Gems and precious metals | $16.1B |
| 30 | Pharmaceuticals | $11.7B |
| 90 | Optical, technical, medical apparatus | $10.5B |
| 39 | Plastics and articles | $7.1B |
| 73 | Articles of iron or steel | $6.6B |
| 94 | Furniture, bedding, lighting | $5.3B |
Vehicles and fuel together are a standing tell: Australia refines almost none of its own petrol and assembles no passenger cars since Holden shut its Adelaide line in 2017, so both lines print big every year. New to chapter codes? Start with how HS codes work before you filter anything.
Who does Australia import from the most?
China dominates. It supplied 35.6% of Australia's goods imports in 2025 per World's Top Exports, and the ABS puts two-way goods-and-services imports from China at A$120.0 billion in 2024-25 — more than the next four suppliers combined. The United States (7.5%), Japan (5.2%), South Korea (5.1%) and Thailand (4.0%) round out the top five. Asia as a bloc covers close to 63% of the goods bill.
Concentration like this is an opening, not a wall. The thin suppliers — India at 1.8%, Vietnam and Singapore at 2.2% each — are exactly where share sits up for grabs as Australian buyers hedge their China exposure. An exporter reading the source split doesn't see a crowded market; it sees five categories where one country holds most of the spend and everyone else is fighting for the rest.
Where does Australia import data actually come from?
Two sources, and they behave very differently. The official one is the ABS, which publishes trade statistics free by commodity, partner country and state — but only in aggregate. There are no importer names, no consignee fields, nothing like the public bill-of-lading manifests behind US import data. You can learn that Australia imported US$11.7 billion of pharmaceuticals; you cannot ask the ABS which Sydney distributor bought them.
That name gap is closed with mirror data: partner-country shipment records that show goods leaving an exporting nation bound for Australia, carrying the Australian consignee where disclosure rules allow. It is the standard playbook for finding buyers with customs data — Australia just forces you to start from the supply side rather than the border. Get the method right and the aggregate ABS tables become the map, while the mirror records become the address book.
How the India Australia ECTA changed the tariff maths
The India-Australia ECTA was signed in April 2022 and entered into force on 29 December 2022. From day one it handed India duty-free access on 98.3% of Australia's tariff lines, moving toward 100% coverage, while India cut duties on more than 70% of its own lines for Australian goods, per the Department of Foreign Affairs and Trade. For labour-intensive Indian exports — textiles, gems, leather, furniture — that was the difference between a 5% landed-cost handicap and a level playing field against ASEAN suppliers who already had free-trade access.
The volume followed. India's exports to Australia more than doubled from US$4 billion in FY2020-21 to US$8.5 billion in FY2024-25, an 8% lift over the prior year, with two-way trade at US$24.1 billion, per India's Ministry of Commerce. By category, petroleum products (US$1.79B), machinery ($375M), pharmaceuticals ($322M), precious stones ($264M) and apparel ($137M) led the lane in FY2025-26 through November, per IBEF.
ECTA didn't create Indian demand in Australia — it removed the tariff excuse a buyer used to say no. The exporters who moved first mapped which Australian importers already bought their HS code, then priced in the duty saving.
Ports and the border: where the containers land
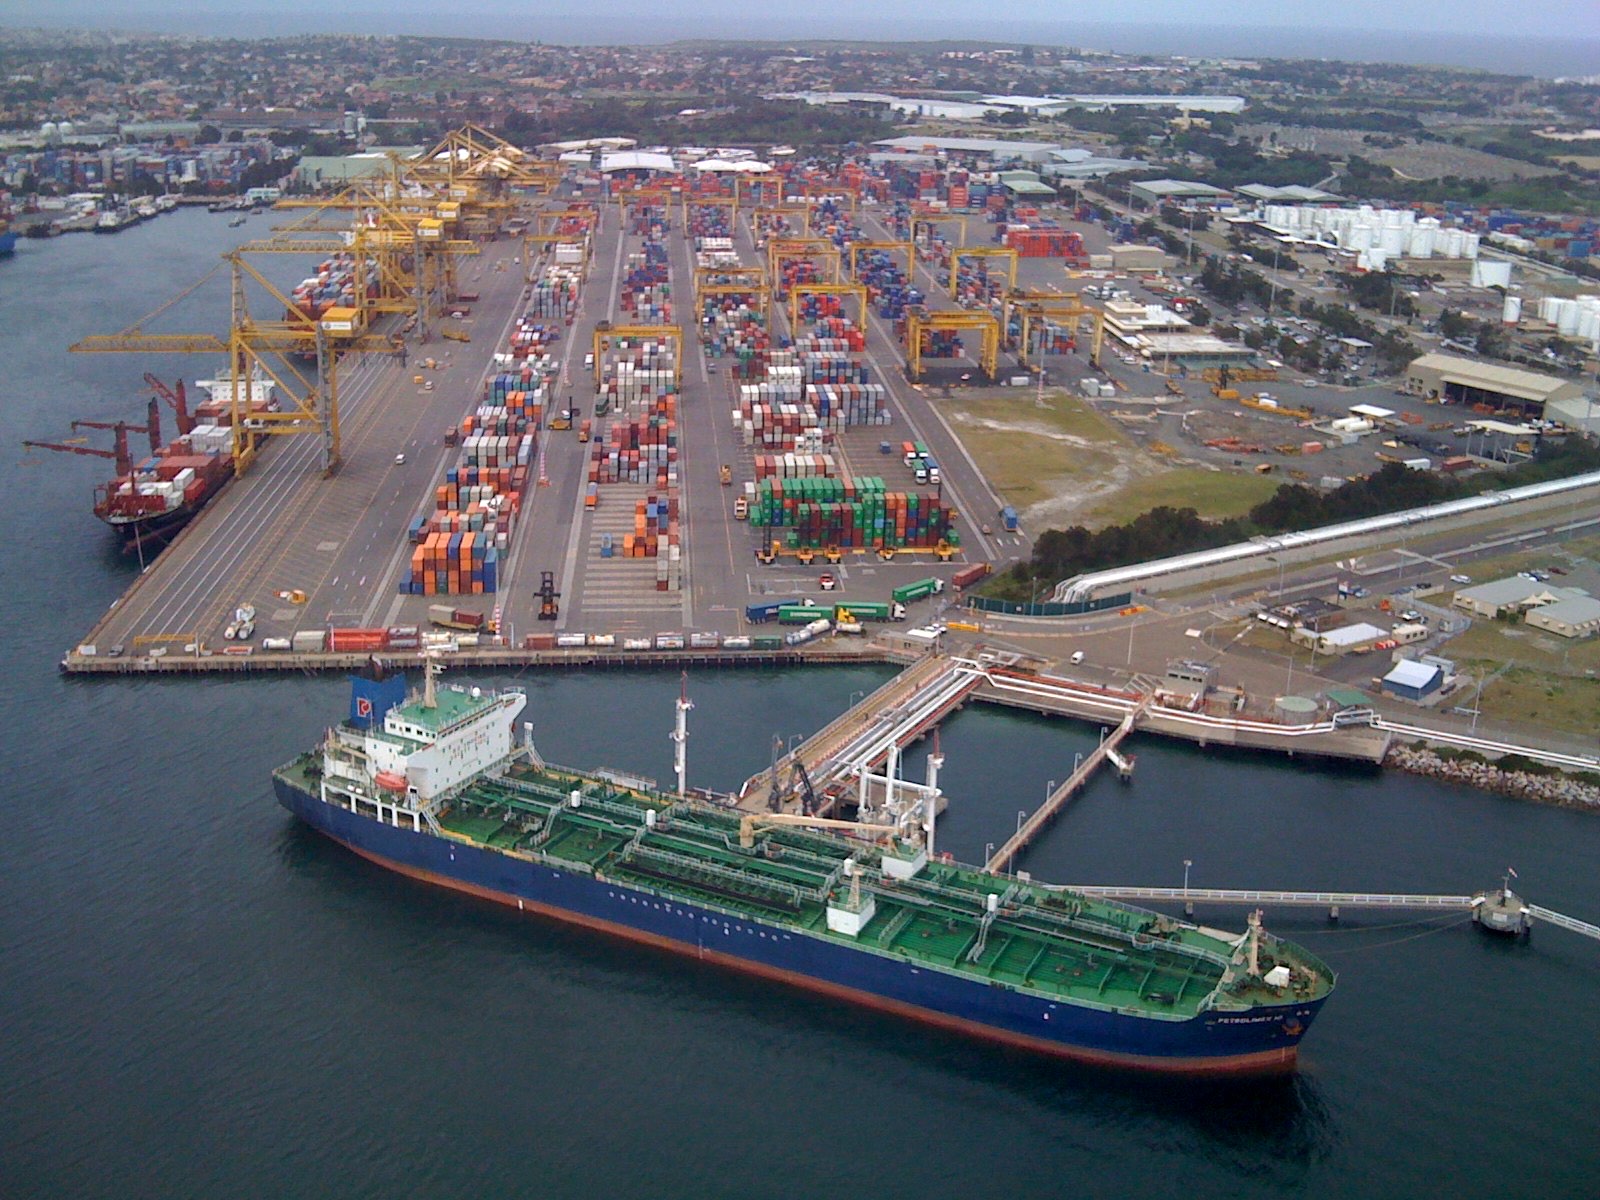
Five container ports move almost everything. The Port of Melbourne is the giant at 3.386 million TEU in 2024-25, up 9% to a record and better than a third of national volume; Port Botany in Sydney is second near 2.8 million TEU, Brisbane the fast riser at about 1.6 million TEU, and Fremantle around 892,000 TEU. Across Brisbane, Sydney, Melbourne, Fremantle and Adelaide, terminals handled 9.1 million TEU in 2024-25, per port throughput data and the BITRE yearbook.
Then comes the border, and Australia runs it hard. Every commercial consignment over A$1,000 needs a Full Import Declaration lodged in the Australian Border Force's Integrated Cargo System, and the ABF collects a biosecurity charge on behalf of the Department of Agriculture, Fisheries and Forestry, with new rates from 1 July 2025. Goods clear against the BICON biosecurity conditions — and practitioners will tell you the single most expensive mistake into Australia is treating biosecurity as paperwork. Untreated timber packaging, uncleared food residue or a missing fumigation certificate gets a container held at the wharf while demurrage runs.
How to use Australia import data to find buyers
Knowing how to find buyers in Australia is a two-layer job: aggregate statistics to pick the product-market, mirror shipment records to name the Australian importers. The sequence practitioners actually run:
- Fix the HS code first. Get the 6-digit heading right — HS 8703 for cars, HS 3004 for packaged medicines — and every later filter behaves.
- Read the ABS trend. Ten minutes shows whether your category grew last year and through which ports, so you pitch a rising lane, not a shrinking one.
- Pull mirror shipment records. Partner-country export data surfaces shipments into Australia with values, volumes, dates and the Australian consignee where available.
- Rank by consistency, not size. An importer landing a container every month beats a one-off bulk buyer who never reorders.
- Layer in ECTA. If you ship from India, quote the duty-free landed cost — it is often the line that turns a maybe into a trial order.
A ranked list of twenty Australian importers who already buy your product beats a scraped directory of two thousand companies who might. Specificity is the whole game.
How ShipScout helps
ShipScout puts 11B+ shipment records across 240+ countries behind one search box, including the Australia import data trail visible through partner-country records, so the workflow above takes minutes rather than weeks:
- Search your product or HS code with Australia as destination and see real flows — values, volumes, origins and dates, not guesses.
- Rank Australian importers by shipment count and recency instead of trawling directories or trade-show lists.
- Profile before you pitch. Open any company in the importer directory to check its trade history, sourcing countries and product mix.
- Reach out with contact intelligence where available, and open with numbers from the buyer's own lane — Indian exporters can pair that with the buyer-shortlisting playbook and India company profiles.
A US$297.5 billion goods-import bill means somebody in Australia already buys what you make. Start a free trial and pull your first ranked list of Australian buyers today.
See who’s importing goods into Australia right now.
ShipScout turns 11B+ shipment records across 240+ countries into a live list of verified buyers and suppliers — ranked by volume, with the contacts to reach them. Create a free account and run your first search in minutes.
Start your free trial →